(Created: 2016-08-29) This is an English translation of a Japanese manuscript "高校保健副教材「妊娠しやすさ」グラフ問題から考える科学リテラシー", prepared for a Tohoku University's pamphlet, Manabi no Mori.
Manabi no Mori, No. 77, Table of contents: http://www.bureau.tohoku.ac.jp/manabi/manabi77/ (2017-03-10 added)
Falsified chart on women's likelihood of pregnancy
In August 2015, the Ministry of Education, Culture, Sports, Science and Technology of Japan (MEXT) prepared a revised version of the side-reader for health education in high schools, entitled "健康な生活を送るために" [To lead a healthy life]. MEXT announced it as the first education material including knowledge on pregnancy and childbirth. It was distributed to all high schools in Japan.
On page 40 of the side-reader is a chart that shows the relation between a woman's age and the likelihood of pregnancy. The curve of this chart was manipulated such that it peaks at the age of 22 years and then drops rapidly. The mass media reported that the shape of this chart differs greatly from that in the original paper. After this issue became publicly known, MEXT corrected the chart. (There are serious problems remaining even after the chart was corrected, but we will not mention them here.)
This chart was not newly created for this high school material. A certain influential gynecologist (YOSHIMURA Yasunori, a former Chairperson of the Executive Board of the Japan Society of Obstetrics and Gynecology (2007-2011) and the Japan Society for Reproductive Medicine (2010-2014) who currently serves as Special Advisor to the Secretariat of the Cabinet Office (2013-)) had used it on his website, as lecture materials, and in a movie for public information prepared by the government.
This scandal triggered my interest in public information and political activities expanding over the academic fields of obstetrics, gynecology, and reproductive medicine. I collected documents on the topic and found out that various charts of doubtful validity have been used. Some charts exaggerated decline of women's fecundity by age, while others fabricated Japan's low level of awareness on pregnancy-related knowledge.
In Japan, these charts first appeared around 2012. It was the beginning of a period during which terms such as "妊活" [activities aiming at getting pregnant] and "卵子の老化" [the aging of the ovum] dominated the mass media. The charts have been used by academic associations such as the Japan Society for Reproductive Medicine (JSRM) and the Japan Association of Obstetricians and Gynecologist (JAOG) in their campaign and lobbying. The charts also served as decision-making grounds by the government. This had an effect on the Abe Cabinet's policy regarding low birthrate. It was part of this policy that the government decided to include knowledge on pregnancy and childbirth in school education.
The importance of investigating the information sources
The details regarding the use of these charts reveal that academics have not fulfilled their responsibilities. The doubtful charts contain data that differs from that used in the original studies, odd interpretations of the data, and data whose methods of measurement and calculation are unclear. Such data should have been rejected based on the principles of academic research to trace the original sources and to confirm the veracity of the data. However, academics did not so. On the contrary, they actively recommended the doubtful charts. It was easy to arouse public attention for a chart that had visual appeal such that "women are most fertile at the age of 22 years" with endorsement by academics. Once such a chart spreads as purported scientific knowledge, it is difficult to correct the errors later on.
This problem teaches us that "science" is actually an institution in society and is strongly influenced by political tactics and the trends of the times. To obtain valid knowledge, we need an adequate level of scientific literacy that will enable us to review literature by ourselves rather than accepting explanations of the government and experts. I hope that school education encourage such literacy.
Figures
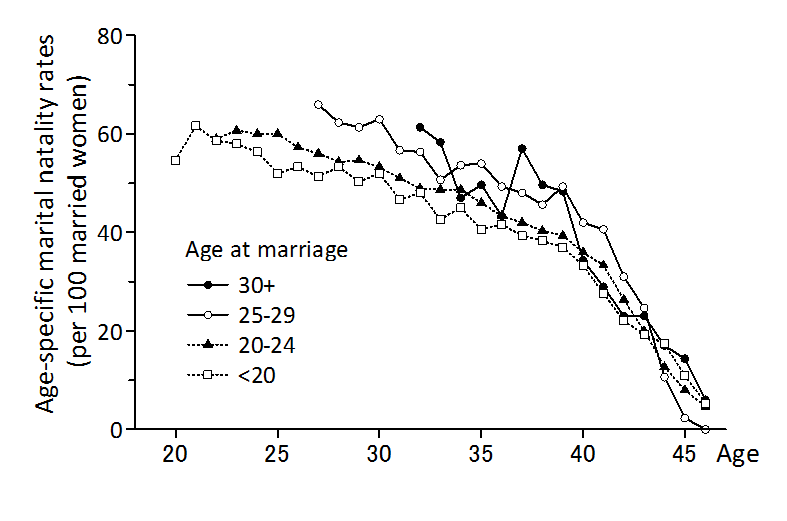
Fig. 1. Age-specific marital fertility (or natality) rates (ASMFR) based on the 1950s-60s data of the Hutterites, who are Christians that do not use contraception or carry out abortion due to religious reasons. Three-year moving average starting from the second year of each column in Table 2 of M. C. Sheps, Population studies 19 (1965). ASFMR are at a high of at least 50% during the newlywed period and decrease as time passes from marriage, which is a common pattern.
http://web.archive.org/web/20150822025627/http://www.mext.go.jp/component/a_menu/education/detail/__icsFiles/afieldfile/2015/08/17/1360938_09.pdf
Fig. 2. The falsified chart of women's age-fecundability profile in the high-school side-reader by MEXT (August 2015, p. 40). The original was Figure 1 of Bendel and Hua, Social biology 25 (1978): composited curve of estimates based on data of Hutterites women married young (correspondent with the two dotted lines in Fig. 1) and Taiwanese women aged 16-24. This chart is a product of unscientific manipulation for three times since then. The text on the right of the chart explains the decline in fecundability only with medical/biological terms, without mentioning socio-cultural factor such as age at marriage, sexual behavior pattern during marital life, and family lifecycle. No description about data sources and the meaning of the curve. No appropriate citation.
See also
- The Mainichi (2015-09-02) Fertility chart in high school education material once again found inappropreate. http://mainichi.jp/english/articles/20150902/p2a/00m/0na/011000c
- Tanaka Sigeto (2015-09-04) Pushing a falsified chart into high-school education material. (Blog article) http://d.hatena.ne.jp/remcat/20150904
- The Japan Times (2015-10-05) Sex Education or Propaganda? http://www.japantimes.co.jp/opinion/2015/10/10/editorials/sex-education-propaganda
- Tanaka Sigeto (2015-10-11) A falsified chart used in political behavior by obstetrician-gynecologists in Japan. (in preparation)
- Tanaka Sigeto (2017-03) Works Citing Bendel and Hua on Natural Fecundability: a literature review on the origin of a falsified chart used in high school education in Japan. Annual Reports of Graduate School of Arts and Letters, Tohoku University. 66 (in printing). http://tsigeto.info/17a
Other documents are listed on http://tsigeto.info/misconduct/ (most of them are in Japanese).
Author of this article
Tanaka Sigeto (Associate professor, Tohoku University)
http://www.sal.tohoku.ac.jp/~tsigeto/office.html
http://twitter.com/twremcat
History of this article
2016-08-29 Created.
2017-03-10 Links added (Tanaka (2017) and Manabi no Mori 77 table of contents).

